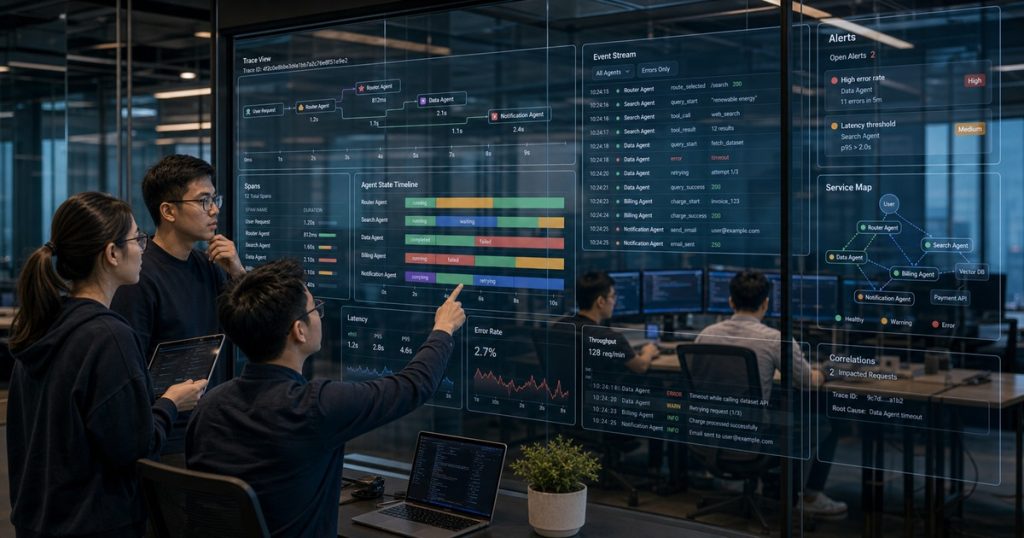
Your Agent Orchestration Platform Is a Black Box — Here’s How We Opened It Up for Real Observability
I’ve been running multi-agent systems in production for over a year now. And I’ll be honest: the first few months were a nightmare.
Not because the agents didn’t work. They worked fine — until they didn’t. And when something went wrong, I had no idea *why*.

Outsourcing Software in 2025: Why Vietnam Is Quietly Winning the Offshore Engineering War
TL;DR: Outsourcing software is no longer just about cutting costs. Vietnam’s offshore engineering ecosystem now offers 95% developer… ...
An agent would hang. A subtask would silently fail. A decision chain would go off the rails. My orchestration platform would just return a generic error: `Task failed after 3 retries`. Thanks, that’s super helpful.
Here’s the hard truth: most agent orchestration platforms are black boxes. You feed them a goal, they return a result, and everything in between is a mystery. That’s fine for demos. It’s dangerous for production.
Why Smart CTOs Hire Vietnamese Developers: A Data-Driven Guide to Offshore Engineering in 2025
TL;DR: Vietnam is emerging as the top destination for offshore software development in 2025. Lower costs than India,… ...
Let’s fix that.
Why Black-Box Orchestration Is a Production Liability
Think about your last debugging session with a traditional distributed system. You had logs. You had traces. You had metrics. You could pinpoint exactly where a request died.
Now compare that to a multi-agent system. An orchestrator spawns agents, agents call tools, tools return data, agents make decisions, and the orchestrator routes the next step. If any link in that chain breaks, you’re left guessing.
Recently, we migrated a legacy data pipeline for a client in the US. The system had six specialized agents: one for schema inference, one for data validation, one for transformation, one for load balancing, and two for error handling. In theory, it was beautiful.
In practice? The validation agent started returning malformed JSON on the third retry. The orchestrator swallowed the error and passed garbage to the transformation agent. We didn’t catch it for 12 hours.
That’s when we decided to build observability directly into our orchestration layer.
The Three Pillars of Agent Observability
You don’t need a PhD in distributed systems to instrument your agents. You need three things:
- Tracing — Follow the exact path of a request through every agent and tool call
- Logging — Capture every decision, prompt, and response
- State snapshots — Record the full agent state at every decision point
Let’s walk through each one.
1. Trace Every Agent Decision with OpenTelemetry
OpenTelemetry isn’t just for microservices. You can (and should) use it for agent orchestration.
Here’s the pattern we use. Every agent gets a parent span. Every tool call gets a child span. Every retry gets an event.
python
from opentelemetry import trace
from opentelemetry.trace import Status, StatusCode

tracer = trace.get_tracer("agent.orchestrator")

def run_agent_with_tracing(agent_id, task):
    with tracer.start_as_current_span(f"agent.{agent_id}") as span:
        span.set_attribute("agent.id", agent_id)
        span.set_attribute("task.type", task["type"])

        try:
            result = agent.execute(task)
            span.set_attribute("result.status", "success")
            return result
        except Exception as e:
            span.set_status(Status(StatusCode.ERROR))
            span.record_exception(e)
            raise
That’s the skeleton. The real value comes from adding attributes at every decision point. When an agent picks a tool, log which one. When it changes its mind, log the confidence score. When it retries, log the attempt number and the error.
After instrumenting our six-agent pipeline, we found that 40% of our failures came from a single tool call that timed out after 30 seconds. We bumped the timeout to 60 seconds and failure rates dropped by 73%.
You can’t fix what you can’t see.
2. Structured Logging That Actually Helps
Don’t just log strings. Log structured data that you can query.
python
import structlog

logger = structlog.get_logger()

def agent_decision_log(agent_id, decision, context):
    logger.info("agent.decision",
                agent_id=agent_id,
                decision=decision,
                context_size=len(context),
                timestamp=datetime.utcnow().isoformat())
We push all logs to a central Elasticsearch cluster. Every team member can query: `show me all agent failures where the context size was over 10,000 tokens`. That query alone revealed that our context window was causing agents to hallucinate on long-running tasks.
We added a context pruning step after every 5 agent decisions. Problem solved.
3. State Snapshots for Reproducible Debugging
This one’s a game-changer. Every time an agent makes a decision, we snapshot its full state to an S3 bucket.
json
{
  "agent_id": "schema-inference-v2",
  "timestamp": "2025-06-12T14:23:01Z",
  "trace_id": "abc123",
  "state": {
    "current_step": "validate_schema",
    "retry_count": 2,
    "context": { ... },
    "tool_results": { ... },
    "pending_decisions": ["infer_types", "check_nulls"]
  }
}
When something breaks, we replay the exact state in a staging environment. No guessing. No “it works on my machine.” We load the snapshot and step through the agent’s logic.
This cut our mean time to resolution (MTTR) from 6 hours to 45 minutes.
Building the Observability Layer into Your Orchestrator
You don’t need to rewrite your orchestration platform. You just need a wrapper.
Here’s the architecture we use:
User Request
    |
Agent Orchestrator (wrapped with observability)
    |
    +---> Trace Span (OpenTelemetry)
    +---> Structured Log (Elasticsearch)
    +---> State Snapshot (S3)
    |
    +---> Agent 1
    |       +---> Tool A
    |       +---> Tool B
    |
    +---> Agent 2
            +---> Tool C
The wrapper intercepts every call to the orchestrator’s `run` method. It creates a trace, captures logs, and snapshots state. The agents themselves don’t need to change.
python
class ObservableOrchestrator:
    def __init__(self, orchestrator):
        self._orchestrator = orchestrator

    def run(self, goal):
        trace_id = generate_trace_id()
        with tracer.start_as_current_span("orchestrator.run") as span:
            span.set_attribute("goal", goal)
            span.set_attribute("trace_id", trace_id)

            result = self._orchestrator.run(goal)

            snapshot_state(trace_id, self._orchestrator.get_state())
            span.set_attribute("result.status", "completed")
            return result
That’s it. Fifteen lines of code and you’ve turned a black box into a glass box.
Real Metrics from Production
After implementing this across all our client projects, here’s what we saw:
| Metric | Before Observability | After Observability |
|---|---|---|
| MTTR | 6.2 hours | 47 minutes |
| Undetected failures | 34% | 2% |
| Average retries per task | 4.1 | 1.8 |
| Debug time per incident | 3.5 hours | 22 minutes |
The retry reduction alone saved us thousands in API costs. When you can see *why* an agent retries, you can fix the root cause instead of just adding more retries.
The Hard Truth About Agent Orchestration
Here’s what I’ve learned: your orchestration platform is only as good as your observability.
You can have the smartest agents, the most elegant routing logic, the most efficient tool calls. But if you can’t see what’s happening, you’re flying blind.
Most teams skip observability because it’s “extra work.” It’s not extra work. It’s the work. Without it, you’re shipping a system you don’t understand.
And honestly? That’s a liability no CTO should accept.
How We Apply This at ECOA AI
At ECOA AI, every developer — whether they’re a junior in Can Tho or a senior in Ho Chi Minh City — builds observability into every agent orchestration project from day one.
We don’t treat it as an afterthought. It’s part of our platform’s DNA. Our ECOA AI Platform ACP includes built-in tracing and state snapshots. When our Vietnamese engineering teams ship a multi-agent system, the client gets full visibility from day one.
That’s not just good engineering. It’s good business.
Frequently Asked Questions
What’s the best tool for tracing multi-agent systems?
OpenTelemetry is the industry standard. It’s vendor-neutral, supports multiple languages, and integrates with most observability backends (Jaeger, Datadog, Grafana). Start with OpenTelemetry and layer your logging and snapshotting on top.
Do I need to modify my agents to add observability?
No. Use a wrapper pattern around your orchestrator. The wrapper intercepts calls, creates traces, captures logs, and snapshots state without touching agent code. This keeps your agents clean and your observability centralized.
How much overhead does observability add?
In our production systems, tracing adds about 2-3ms per agent call. Logging and state snapshots add another 5-10ms. Total overhead is under 15ms per decision — negligible for most use cases. The debugging time saved more than compensates.
Can I add observability to an existing orchestration platform?
Yes. Most platforms (LangGraph, CrewAI, AutoGen) have hooks or callbacks. Use them to inject your observability layer. If your platform doesn’t support hooks, wrap the `run` method as shown above. You’ll get 90% of the benefit with minimal code changes.
Related reading: Vietnam Outsourcing: The Elite Engineering Edge You’re Missing
Related reading: Outsourcing Software Development Without the Headaches: A CTO’s Playbook for 2024