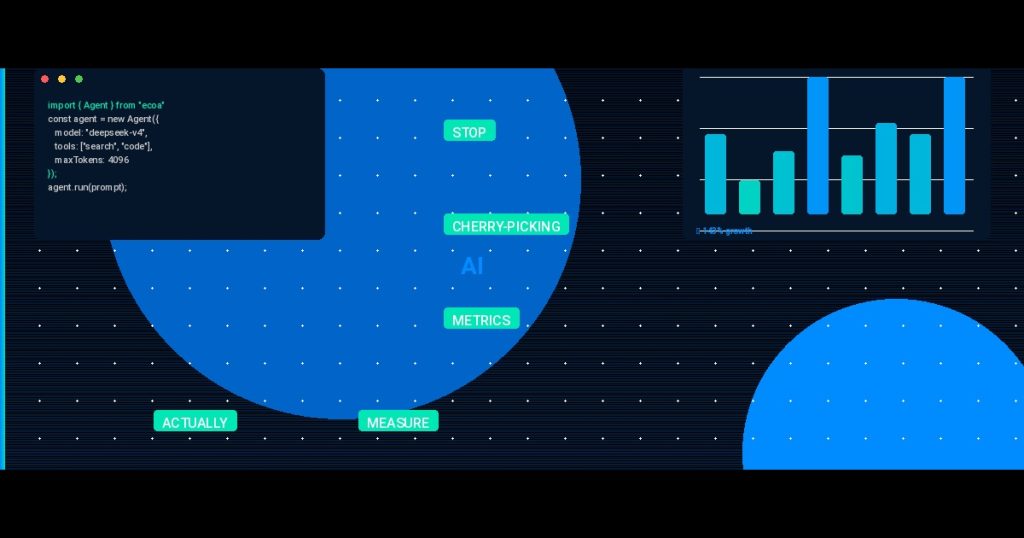
Stop Cherry-Picking Metrics: How to Actually Measure AI Coding Tool Productivity
Every engineering team I talk to has the same story. They’ve deployed GitHub Copilot, Cursor, or Claude Code. They see PRs flying faster. They *feel* more productive.
But when I ask them for hard numbers? Crickets.
How to Cut Your Open Source CI/CD Time by 90% (and Still Ship Reliable Code)
How to Cut Your Open Source CI/CD Time by 90% (and Still Ship Reliable Code) I polled 50… ...
“I’m pretty sure we ship 30% more features now.” That’s not a metric. That’s a guess.
Here’s the hard truth: if you can’t measure productivity accurately, you’re probably optimizing for the wrong thing — or worse, justifying a failed investment with cherry-picked stats.
Stop Juggling 10 Tools: How GitHub Issues, Discussions, and Projects Can Run Your Open Source Project
Stop Juggling 10 Tools: How GitHub Issues, Discussions, and Projects Can Run Your Open Source Project I’ve been… ...
I’ve spent the last year building a real measurement framework for AI coding tools across multiple teams — including our own at ECOAAI. We run an elite team of Vietnamese engineers augmented by AI orchestration, and we had to figure out which tools actually work. Not just “feels fast,” but real, measurable gains.
Let me show you exactly what we track, why, and how you can apply this tomorrow.
Why Vanity Metrics Will Lie to You
The easiest metric to capture? Lines of code generated per day.
It’s also the most dangerous.
A team of juniors with a powerful AI tool can churn out 2,000 lines a day. A senior engineer writing critical infrastructure might produce 200. Guess who’s more productive? That’s a trick question — the senior’s 200 lines probably pass code review on first try, never cause a production bug, and are documented. The AI-generated 2,000? Half gets reverted in the next sprint.
So what should you measure?
Don’t look at output alone. Look at *throughput with quality*.
The 4 Metrics That Actually Matter
We converged on four core indicators after testing dozens of variables. Here’s the framework:
| Metric | What It Captures | Why It Matters |
|---|---|---|
| Time-to-Merge (TTM) | Hours from first commit to PR merged | Direct measure of velocity. AI should reduce idle time and rework cycles. |
| Code Rework Ratio | % of new code that’s modified or reverted within 30 days | Covers hidden cost of low-quality AI output. Higher ratio = more wasted tool output. |
| Developer Satisfaction Index | Weekly survey: “How much of your day was spent on meaningful work vs. fighting tool output?” | If the tool frustrates devs, adoption dies. Raw productivity doesn’t matter if your best engineers quit. |
| Context Preservation | % of AI-generated code that respects existing project conventions (linting, patterns, naming) | Most AI tools ignore codebase conventions. This metric catches the subtle “code rot” that accumulates. |
Let me unpack the one that surprised us most.
The “Context Preservation” Trap
You’d think every AI coding tool would look at your existing code style before generating. They don’t. Not really.
We built a small Python script that checks every AI-generated block against our ESLint config, naming conventions, and module structure. The result? One tool had a 67% convention violation rate in its first week of use. Those “productivity gains” were actually future technical debt.
So we added Context Preservation as a mandatory gate in our CI pipeline. Any AI-generated code that fails convention checks gets flagged and sent back to the developer. Sounds heavy? Actually, it forces the developer to either fix it or improve the prompt context. Over two months, violations dropped to 12%. Developer satisfaction *increased* because they stopped cleaning up messes.
How to Set Up Your Measurement Pipeline
Don’t just collect these metrics manually. Automate the hell out of it. Here’s the skeleton of a GitHub Action that captures TTM and Rework Ratio:
yaml
name: Track AI Productivity Metrics
on: [pull_request, push]

jobs:
  measure:
    runs-on: ubuntu-latest
    steps:
      - uses: actions/checkout@v3
      - name: Check Context Preservation
        run: |
          # Count lines added vs lines that pass lint
          ADDED=$(git diff origin/main --numstat | awk '{s+=$1} END {print s}')
          PASSES=$(eslint . --quiet | wc -l)
          echo "Violations: $PASSES in $ADDED lines"
      - name: Log Timestamps
        run: |
          # Record PR open time vs merge time for TTM
          echo "PR opened: $(date -d @${{ github.event.pull_request.created_at }} +%s)"
Honestly, that’s just a starting point. You’ll want to push these to a time-series database. We use a simple Postgres table with a cron job to aggregate weekly.
The Human Factor: Why Developer Satisfaction Is Non-Negotiable
Real story: A team in Ho Chi Minh City adopted Claude Code across their 12-person squad. First two weeks: TTM dropped 40%. Awesome, right?
Week three: two senior engineers requested transfers. The tool was generating so much bad code that they spent every afternoon rewriting it. Their satisfaction index dropped from 8.5/10 to 4.2/10.
We helped them add the Context Preservation gate and tune prompts per repository. Satisfaction climbed back to 7.8. TTM settled at a 25% improvement — smaller, but *sustainable*.
Don’t skip the human side. If your developers hate the tool, the productivity gains will evaporate in a quarter.
Pitfalls to Avoid
- Measuring too early. Give the team 2–4 weeks to adapt before collecting data. The first week’s metrics will be artificially low (or high) due to novelty.
- Averaging across all repos. A greenfield project and a legacy monolith have completely different AI tool effectiveness. Segment your measurements by project type.
- Ignoring tool cost per delivered feature. If your AI token bill goes up 3x but velocity only improves 20%, you’re losing money.
Putting It All Together
You don’t need a complex dashboard in a spreadsheet. Track four things:
- Time-to-Merge (per PR, per developer)
- Code Rework Ratio (% of lines reverted in 30 days)
- Developer Satisfaction (weekly 2-question survey)
- Context Preservation (automated convention checks)
Use the first month as a baseline without AI tools. Then roll out the tool and measure against that baseline. Adjust based on developer feedback. Iterate.
That’s it. No cherry-picking. No “X% more features” with a wink.
—
A quick note about our team at ECOAAI: We’ve applied this exact framework with our Vietnamese engineers in Ho Chi Minh City and Can Tho. The combination of AI coding tools and our ECOA AI Platform orchestration has produced measurable improvements — but only because we forced ourselves to measure honestly. That’s the only way to know if your investment is working.
Now go build your measurement pipeline. And stop guessing.
Frequently Asked Questions
How long should we measure before concluding a tool is effective?
At minimum, 4 weeks of stable usage. The first two weeks are noise as developers learn the tool’s quirks. Use the third and fourth weeks for comparison against your baseline.
Should we enforce Context Preservation on every AI-generated submission?
If your codebase has established conventions, yes. We found that a soft warning (not blocking) for the first week helps adoption, then switch to required passing after 7 days. Otherwise, your lint rules become irrelevant.
What’s the best way to measure Developer Satisfaction without survey fatigue?
A single weekly question: “On a scale of 1–10, how much of your time this week was spent on meaningful problem-solving vs. correcting AI-generated code?” Track the average and the trend. If it drops below 6, investigate immediately.
Can this framework apply to open-source projects too?
Absolutely. For OSS, focus on Time-to-Merge and Context Preservation — especially if multiple contributors use different AI tools. The rework ratio is harder to track without a consistent CI pipeline.
Related reading: Why Vietnam Outsourcing Is Winning the Offshore Software Development Race
Related reading: Outsourcing Software: The Brutal Truth About Building with Offshore Teams in 2025