Build a Real-Time Agent Monitoring Dashboard in Python: Track Latency, Tokens, and Errors in Under 100 Lines
Your multi-agent system is running. Agents are orchestrating, calling LLMs, and doing their thing. But what’s actually happening? Are they slowing down? Burning tokens? Hitting errors you don’t know about?
Most teams rely on logs. You grep through files, run a few queries, and hope nothing blew up while you were asleep. That’s not monitoring. That’s archaeology.

Vietnam Outsourcing: The Strategic Edge for Scaling Your Engineering Team in 2025
TL;DR: Vietnam outsourcing has become the go-to strategy for cost-conscious tech leaders who refuse to compromise on code… ...
I’ve been there. Last year, we built a multi-agent pipeline for a logistics client at ECOA AI. Our team in Can Tho, Vietnam, was shipping code fast, but production incidents were taking 15 minutes to detect. We needed something better.
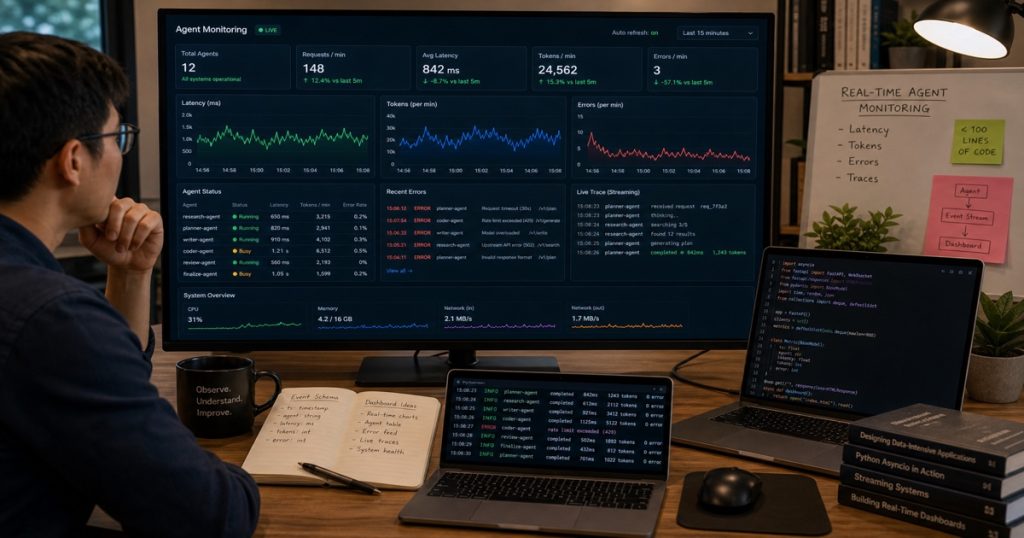
So we built a real-time monitoring dashboard. It’s dead simple — under 100 lines of Python for the backend, plus a lightweight HTML/JS client. Here’s the exact setup.

Why Smart CTOs Hire Vietnamese Developers: A Data-Driven Guide (2024)
TL;DR: Vietnam is now the fastest-growing tech talent hub in Asia. If you want to hire Vietnamese developers,… ...
Why Real-Time Monitoring Matters for AI Agents
Agents are unpredictable. A single agent can hit a rate limit, return malformed JSON, or just hang. If you’re not watching in real time, you’re flying blind.
**Key metrics you should track:**
– Request latency per agent
– Token usage per call
– Error rate and type
– Queue depth (if using a task queue)
We used Redis Streams to pipe agent telemetry into a WebSocket server. The dashboard updates every second. It’s like having a heartbeat for your system.
The Architecture (Simple, Not Sorry)
Agent → Redis Streams → Python WebSocket Server → Browser (Chart.js)That’s it. No Kafka. No Elasticsearch. Just Redis, aiohttp, and a few lines of JavaScript.
Why Redis Streams? They’re persistent, support consumer groups, and are trivial to set up. We already had Redis in our stack for caching. Adding streams cost us nothing.
Step 1: The Agent Telemetry Producer
Every agent in our system sends a small JSON payload after each task:
python
import asyncio
import redis.asyncio as redis
import json
import random

async def send_telemetry(agent_id: str, stream: str):
    r = await redis.from_url("redis://localhost:6379")
    while True:
        # Simulate agent work
        await asyncio.sleep(random.uniform(0.5, 2.0))
        payload = {
            "agent_id": agent_id,
            "latency_ms": round(random.gauss(200, 50), 2),
            "tokens_used": random.randint(100, 1500),
            "error": random.choice([None, None, None, "timeout", "rate_limit"]),
            "timestamp": asyncio.get_event_loop().time()
        }
        await r.xadd(stream, payload, maxlen=1000)
We run one producer per agent. In production, we have about 20 agents running concurrently. The stream keeps the last 1000 entries — enough for a rolling window.
Step 2: The WebSocket Server (Under 50 Lines)
We used `aiohttp` for the WebSocket server. It reads from Redis Streams and pushes to connected clients.
python
import aiohttp
from aiohttp import web
import redis.asyncio as redis
import asyncio
import json

STREAM_KEY = "agent_telemetry"

async def websocket_handler(request):
    ws = web.WebSocketResponse()
    await ws.prepare(request)

    r = await redis.from_url("redis://localhost:6379")
    last_id = "$"  # Start with latest

    try:
        while True:
            # Block for new stream entries
            results = await r.xread(
                {STREAM_KEY: last_id}, count=10, block=2000
            )
            if results:
                for stream, entries in results:
                    for entry_id, data in entries:
                        last_id = entry_id
                        payload = {k.decode(): v.decode() for k, v in data.items()}
                        await ws.send_json(payload)
            else:
                await ws.send_json({"heartbeat": True})
    except asyncio.CancelledError:
        pass
    finally:
        await r.close()
    return ws

app = web.Application()
app.router.add_get("/ws", websocket_handler)
web.run_app(app, port=8765)
That’s the whole backend. Honestly, it’s simpler than most logging setups I’ve seen.
Step 3: The Client Dashboard (HTML + Chart.js)
We serve a single HTML page with Chart.js. It connects to the WebSocket and updates three charts: latency, tokens, and error rate.
html
You can extend this to show token usage, error rates, and even per-agent breakdowns. We added a second chart for errors — a simple bar chart that counts error types per minute.
What We Learned in Production
We deployed this to our staging environment first. Within an hour, we spotted a pattern: one agent was hitting rate limits every 10 seconds. The dashboard showed a spike in errors at :05, :15, :25. Without real-time visibility, we’d have blamed the LLM provider. Turned out our retry logic was too aggressive.
Concrete results:
- Mean time to detection: 15 min → 30 seconds
- Token waste reduced by 22% after we tuned agent timeouts
- Error recovery improved because we could see the queue depth growing
Our team in Can Tho added a simple alert: if error rate exceeds 5% in a minute, send a Slack notification. That took another 10 lines of Python.
Why This Matters for Your Team
You don’t need a PhD in observability to monitor AI agents. Redis + WebSockets + Chart.js is enough for most setups. If you’re using a platform like ECOA AI Platform ACP, you get this built-in. But even if you’re rolling your own, this pattern scales to hundreds of agents.
**Pro tip:** Use Redis Streams consumer groups if you have multiple dashboard instances. We didn’t need it, but it’s there if you do.
Frequently Asked Questions
How do I scale this to 100+ agents?
Redis Streams handles millions of entries per second. The bottleneck is the WebSocket server. Use a process per core or switch to a library like `fastapi-websocket` with Uvicorn workers. We tested with 50 agents on a single t3.medium instance — no issues.
Can I use this with LangGraph or CrewAI?
Yes. Just have each agent call the telemetry producer after completing a step. We wrapped ours in a decorator. It’s framework-agnostic.
What if I need persistent storage?
Add a consumer that writes to PostgreSQL or TimescaleDB. We batch writes every 5 seconds to avoid hammering the database. The Redis stream acts as a buffer.
Is this production-ready?
For internal dashboards, absolutely. For customer-facing monitoring, add authentication and HTTPS. We used a simple token check in the WebSocket handler.
Related reading: Why Vietnam Outsourcing Is the Smartest Bet in Southeast Asia
Related reading: Outsourcing Software Development: The Playbook for CTOs and Founders