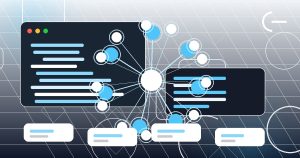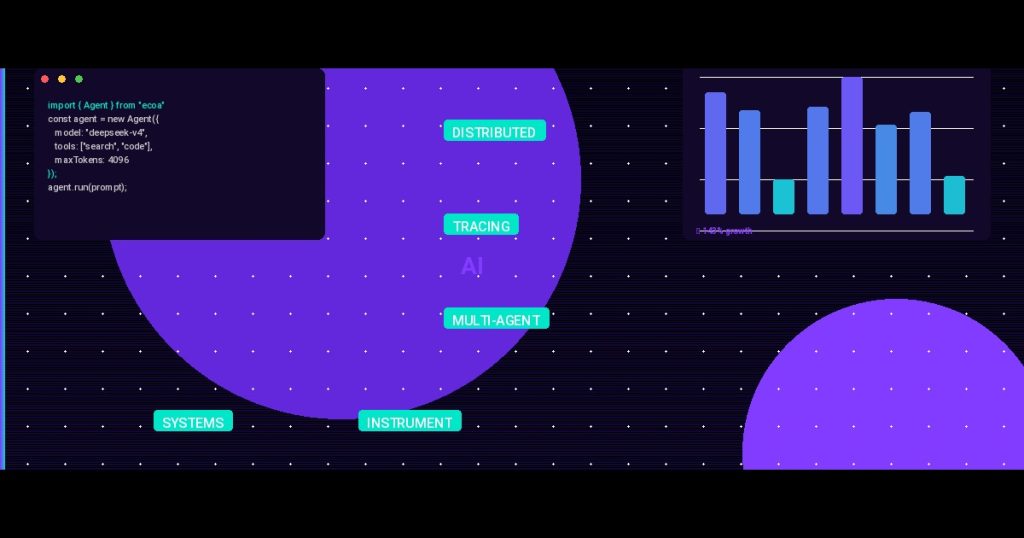
Distributed Tracing for Multi-Agent Systems: How to Instrument Your Agents with OpenTelemetry for Production Visibility
You’ve deployed a multi-agent system. It works in dev. Then production hits, and suddenly Agent A is slow, Agent B is sending malformed data, and Agent C just hangs forever. You have logs everywhere, but you can’t connect the dots.
It’s a nightmare.

5 Open Source AI Tools on GitHub That Actually Deliver (Personal Picks)
You know the feeling. You’re browsing GitHub, bookmarking repo after repo, convinced you’ve found the holy grail of… ...
I’ve been there. We built a multi-agent document processing pipeline for a legal tech client out of Ho Chi Minh City. On paper, the architecture was clean. In production, debugging took hours. The problem? No end-to-end visibility.
Traditional logging gives you isolated events. But in a multi-agent system, what matters is the *chain* of calls. Who called whom? How long did each step take? Where did the data get corrupted?

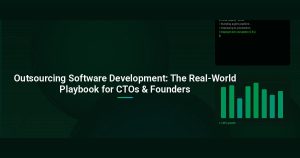
Why Outsourcing Software Development Still Works in 2025 — And How to Get It Right
TL;DR: Outsourcing software development can cut costs by 40-60% and accelerate delivery, but only if you pick the… ...
That’s where distributed tracing comes in. And the open standard everyone should use is OpenTelemetry.
Here’s how to instrument your agents so you can trace every workflow from start to finish.
Why Manual Logging Fails in Multi-Agent Systems
Think about a typical agent orchestration flow:
- User request comes in.
- Orchestrator agent parses intent.
- Calls a retrieval agent.
- Retrieval agent calls an embedding API.
- Orchestrator calls an LLM agent.
- LLM agent calls a validation agent.
- Validation agent returns result.
That’s seven distinct steps. If something goes wrong at step 5, you need to know exactly what happened at steps 3 and 4. With plain logs, you’re manually correlating timestamps. It’s fragile. It’s slow. And it doesn’t scale.
You’ll end up asking: *”Did the embedding API timeout, or was the LLM agent’s context too large?”*
You can’t answer that without a trace.
OpenTelemetry: The Universal Instrumentation Layer
OpenTelemetry (OTel) is the industry standard for collecting traces, metrics, and logs. It’s vendor-neutral. It works with any backend (Jaeger, Grafana Tempo, Datadog, etc.). And it’s relatively painless to add to Python, Node.js, or Go agents.
The core concepts:
- Trace – represents an entire workflow (e.g., processing one document).
- Span – a single unit of work within the trace (e.g., calling the LLM).
- Context propagation – allows you to pass trace info across service boundaries (HTTP headers, message queue metadata).
For multi-agent systems, each agent should create a child span for every external call it makes. The orchestrator creates the root span.
Instrumenting a Python Agent: Step by Step
Let’s take a simple agent that calls an LLM and then a validation service. We’ll use the OpenTelemetry Python SDK.
python
from opentelemetry import trace
from opentelemetry.sdk.trace import TracerProvider
from opentelemetry.sdk.trace.export import BatchSpanProcessor
from opentelemetry.exporter.otlp.proto.grpc.trace_exporter import OTLPSpanExporter
from opentelemetry.instrumentation.requests import RequestsInstrumentor

# Set up tracer provider
provider = TracerProvider()
processor = BatchSpanProcessor(OTLPSpanExporter(endpoint="http://localhost:4317"))
provider.add_span_processor(processor)
trace.set_tracer_provider(provider)

# Auto-instrument HTTP calls
RequestsInstrumentor().instrument()

tracer = trace.get_tracer(__name__)

def process_document(document):
    with tracer.start_as_current_span("process_document") as root_span:
        root_span.set_attribute("document.id", document["id"])
        root_span.set_attribute("document.size", len(document["content"]))

        # Call LLM agent
        llm_result = call_llm_agent(document["content"])
        root_span.set_attribute("llm.tokens", llm_result["tokens"])

        # Call validation agent
        validation_result = call_validation_agent(llm_result["text"])
        root_span.set_attribute("validation.score", validation_result["score"])

        return validation_result
Notice we’re automatically instrumenting HTTP calls made by `requests`. Every API call to the LLM provider or the validation service becomes a child span. Without adding a single manual span inside those calls.
But agents aren’t always synchronous HTTP. Sometimes they communicate via message queues. That’s where context propagation becomes critical.
Propagating Context Across Async Agents
Imagine Agent A sends a message to a Redis pub/sub channel, and Agent B picks it up and processes it. Without propagation, Agent B will start a new trace. You lose the connection.
You need to inject the trace context into the message payload. Here’s how with Redis:
python
from opentelemetry import propagate
from opentelemetry.trace.propagation.tracecontext import TraceContextTextMapPropagator

# Agent A: sending
carrier = {}
propagate.inject(carrier)
message = {"payload": data, "trace_context": carrier}
redis_client.publish("agent_channel", json.dumps(message))

# Agent B: receiving
message = json.loads(redis_client.subscribe("agent_channel"))
carrier = message.get("trace_context", {})
ctx = propagate.extract(carrier)
# Use the extracted context to start a new span within the same trace
with tracer.start_as_current_span("agent_b_work", context=ctx):
    # process the message
    pass
Do this for every async boundary. It’s a few lines but makes the difference between a cohesive trace and broken spaghetti.
What to Trace (and What to Skip)
I see teams over-instrumenting everything. Don’t. Focus on the critical path:
- Agent entry points – every call from the orchestrator.
- External API calls – LLMs, embeddings, databases, vector stores.
- Internal computation – only if it’s CPU-heavy or could fail.
- Decision points – where the agent branches based on conditions.
Skip tracing trivial local functions. They add noise.
But, do trace every retry and fallback. That’s where you learn your system’s resilience (or lack thereof).
We once traced a system where the embedding agent retried 5 times silently before failing. The root cause? A misconfigured timeout. Without tracing, we’d never have seen the retry chain.
Choosing a Backend: Jaeger for Quick Wins
For local development, Jaeger is the easiest. Spin it up with Docker:
bash
docker run -d --name jaeger \
  -e COLLECTOR_OTLP_ENABLED=true \
  -p 16686:16686 \
  -p 4317:4317 \
  -p 4318:4318 \
  jaegertracing/all-in-one:latest
Then point your OpenTelemetry exporter to `localhost:4317`. Visit `http://localhost:16686` to search traces.
For production, use Grafana Tempo or a cloud vendor. The protocol is the same.
Real Example: What We Found in Production
A fintech client in Can Tho had a multi-agent system for fraud detection. Agents were constantly timing out. The logs showed no obvious pattern.
We instrumented with OpenTelemetry. Within an hour, the traces revealed:
- The “risk scoring” agent was calling an external API with a 3-second timeout.
- The API occasionally took 5+ seconds.
- The orchestrator’s timeout for the entire workflow was 4 seconds.
So even if the first agent completed quickly, the second agent’s delay caused the whole trace to fail. The fix? Increase the orchestrator’s timeout to 10 seconds and add a separate timeout for each agent.
That’s the kind of insight you only get from distributed tracing.
Common Pitfalls
- Not propagating context in async channels – your traces will be fragmented.
- Too many spans – 100 spans per request creates noise. Cap at 50.
- Forgetting to sample – tracing every request in high-throughput systems is expensive. Use head-based sampling (e.g., 10%).
- Ignoring trace annotations – add key custom attributes (document ID, user ID, agent version). They make filtering possible.
How to Get Started
- Instrument your orchestrator agent with a root span.
- Auto-instrument HTTP/gRPC clients.
- Propagate context across all async boundaries.
- Export to Jaeger locally.
- Add custom attributes for business-relevant data.
- Set up sampling rules before going to production.
It’s not a weekend project. But it’s the single highest-leverage improvement you can make to your multi-agent system’s observability.
Trust me. You’ll wonder how you ever lived without it.
—
Frequently Asked Questions
What’s the difference between distributed tracing and logging?
Logging records individual events at a single point in time. Distributed tracing connects those events across service boundaries into a single end-to-end view. For multi-agent systems, tracing shows you the *path* a request takes through different agents, including latency at each hop and where errors originated.
Do I need to instrument every agent manually?
Not entirely. OpenTelemetry provides auto-instrumentation libraries for popular frameworks (Flask, Django, FastAPI, requests, etc.). For agents that communicate via HTTP or gRPC, you get spans automatically. For custom message queues or in-process calls, you’ll need to add manual instrumentation—but it’s minimal.
Can I use distributed tracing with non-HTTP agents (e.g., agents running in separate processes)?
Yes. You need to propagate the trace context through whatever communication channel you use—Redis pub/sub, Kafka, RabbitMQ, even shared files. The principle is the same: inject the context into the message payload, then extract it on the receiving side. OpenTelemetry provides `propagate.inject()` and `propagate.extract()` for this.
How much overhead does tracing add?
Auto-instrumentation adds minimal overhead (usually <2% latency). Manual instrumentation is negligible. The real cost comes from exporting and storing traces. Use sampling (e.g., 1-10% of requests in production) to control costs. Head-based sampling is standard—you decide whether to trace a request at the entry point.